Category: Data Visualization / Consumer Insights
Tools: Power BI, DAX, Custom Report Theming
Overview
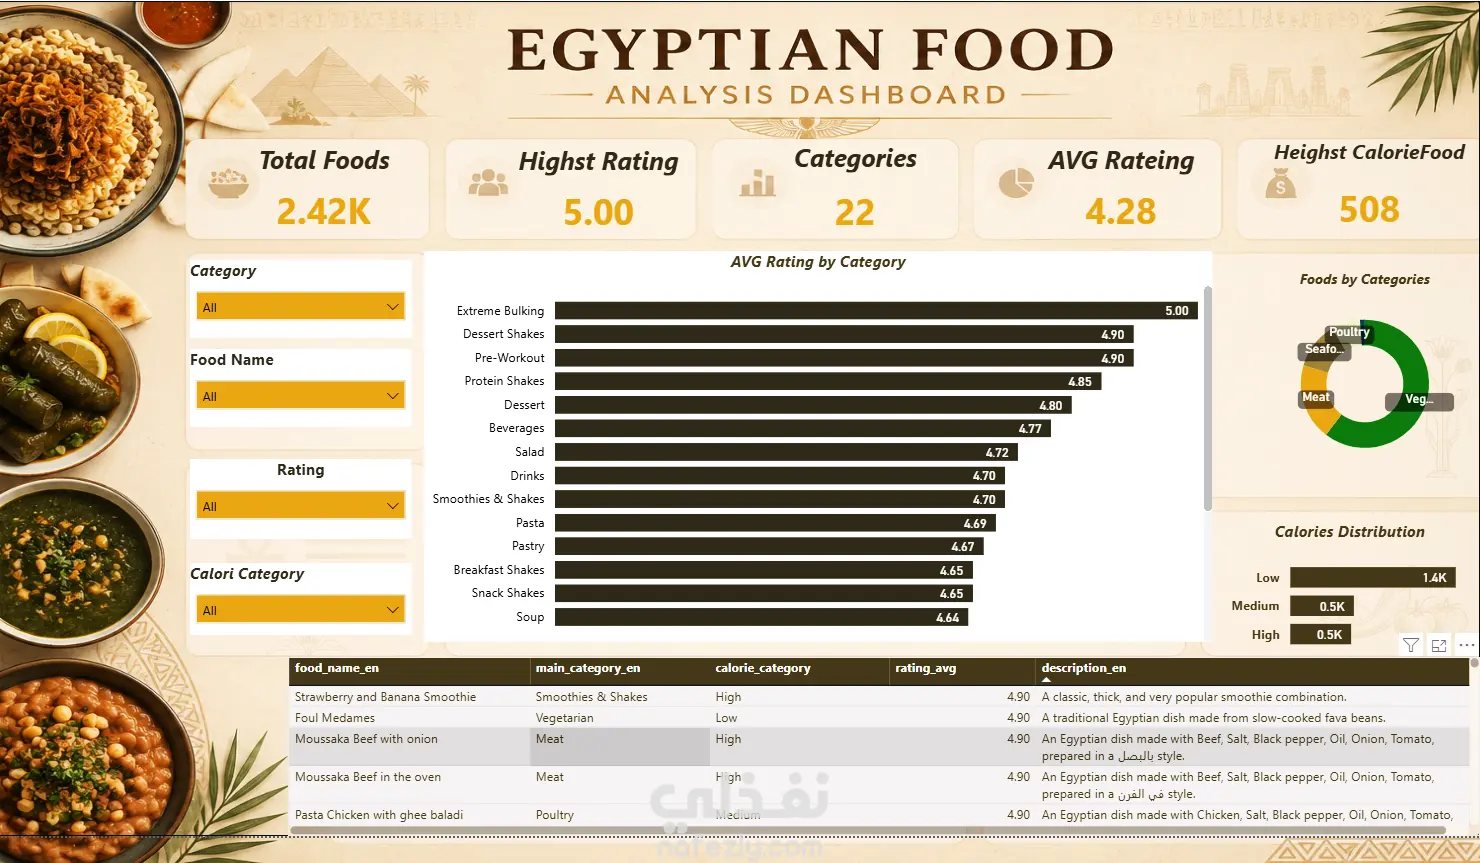
An interactive dashboard analyzing ratings and calorie profiles across a dataset of Egyptian dishes, built with a fully custom Egyptian-themed visual identity.
Data Model & Approach
Built a fact table of foods (category, calorie level, rating) alongside a dedicated measures table (Total_Foods, Average_Rating, Highest_Rating, High Calorie Foods).
Key Features
Interactive slicers for category, food name, calorie level, and rating
Average rating by category, category distribution, and calorie distribution (Low/Medium/High)
Fully custom visual theme (imagery, warm color palette) instead of default Power BI styling
Skills Demonstrated
Custom report theming · categorical & numerical KPI analysis · interactive filtering · DAX measure creation