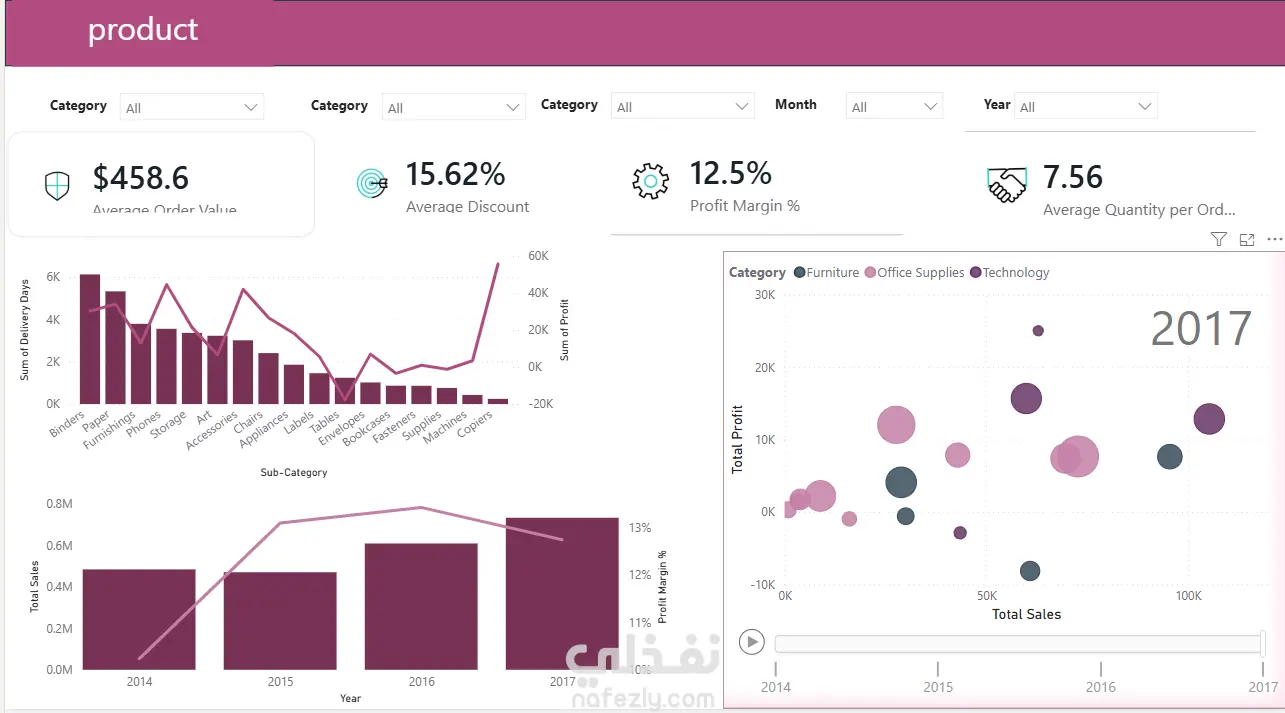
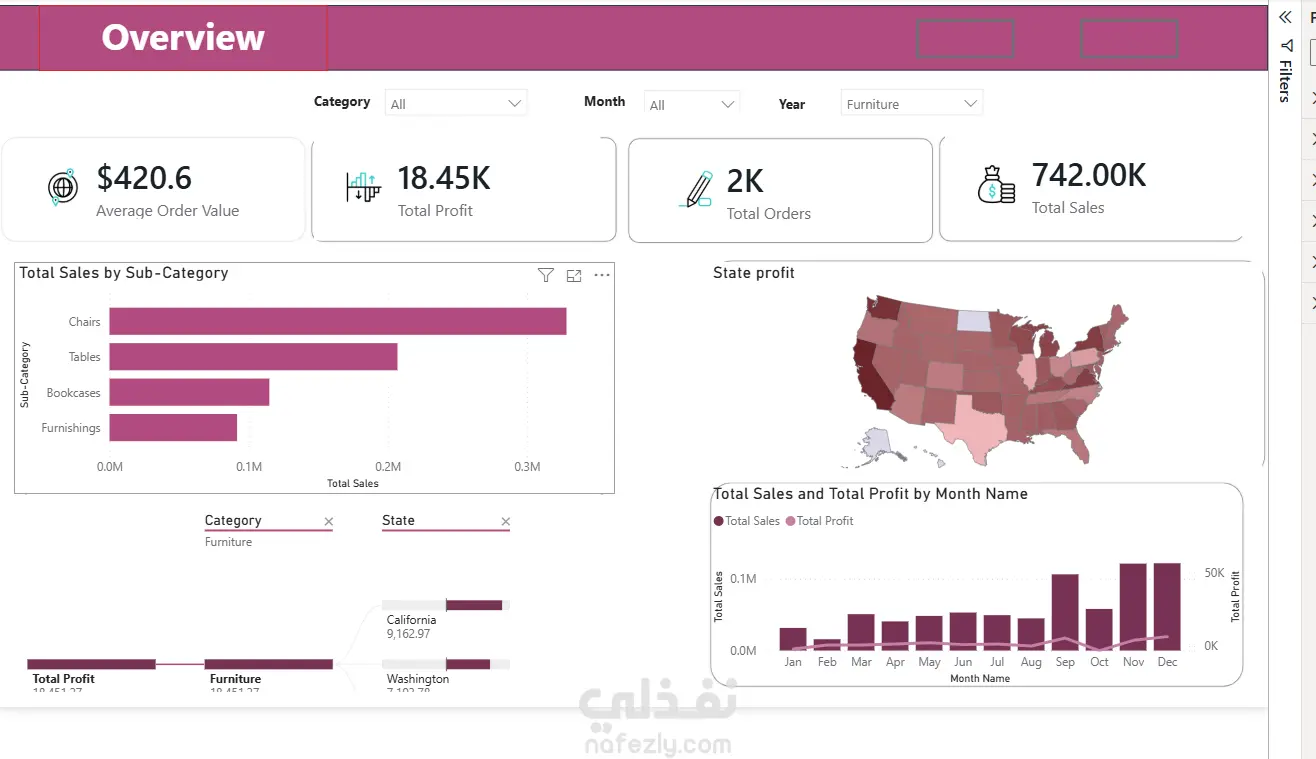
Designed an interactive Power BI dashboard to analyze sales performance across categories, sub-categories, and years. The dashboard tracks key business metrics such as Average Order Value, Average Discount, Profit Margin, and Average Quantity per Order. It also provides insights into sales trends, product profitability, and category performance using interactive filters and visualizations to support business decision-making.