Supply Chain Dashboard | Microsoft Excel
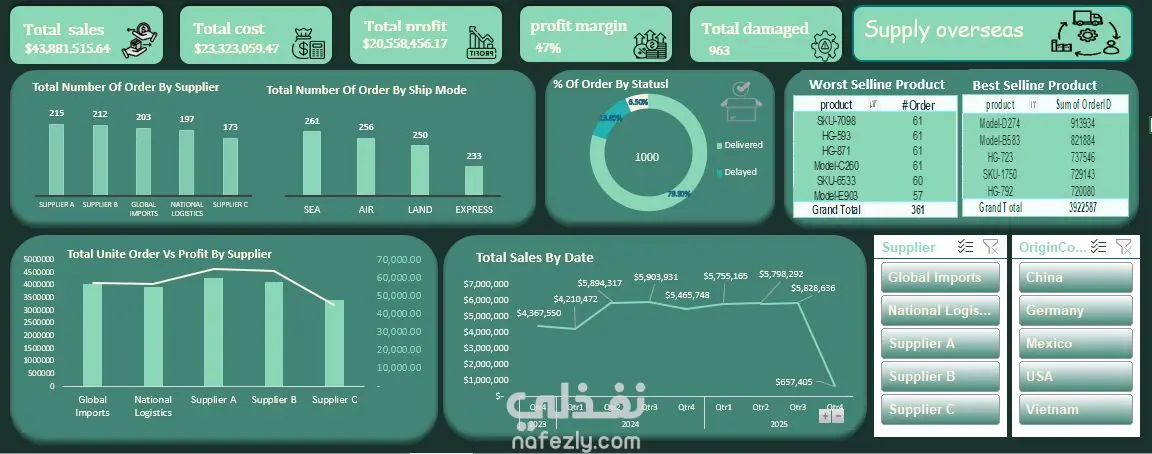
I'm excited to share one of my recent Excel Dashboard projects, where I analyzed supply chain data and transformed it into an interactive dashboard to support better business decisions.
🔍 Key Features:
• Total Sales, Cost, Profit & Profit Margin
• Total Damaged Products
• Sales Trend Analysis
• Orders by Supplier
• Orders by Shipping Mode
• Order Status Distribution
• Best & Worst Selling Products
• Interactive Slicers for Supplier and Country of Origin
🛠 Tools & Skills Used:
• Microsoft Excel
• Pivot Tables
• Pivot Charts
• Slicers
• Data Cleaning
• Data Analysis
• Dashboard Design
Through this project, I enhanced my ability to transform raw data into meaningful insights and build interactive dashboards that help businesses monitor performance and make data-driven decisions.