Uber Data Analysis & Optimization Project
تفاصيل العمل
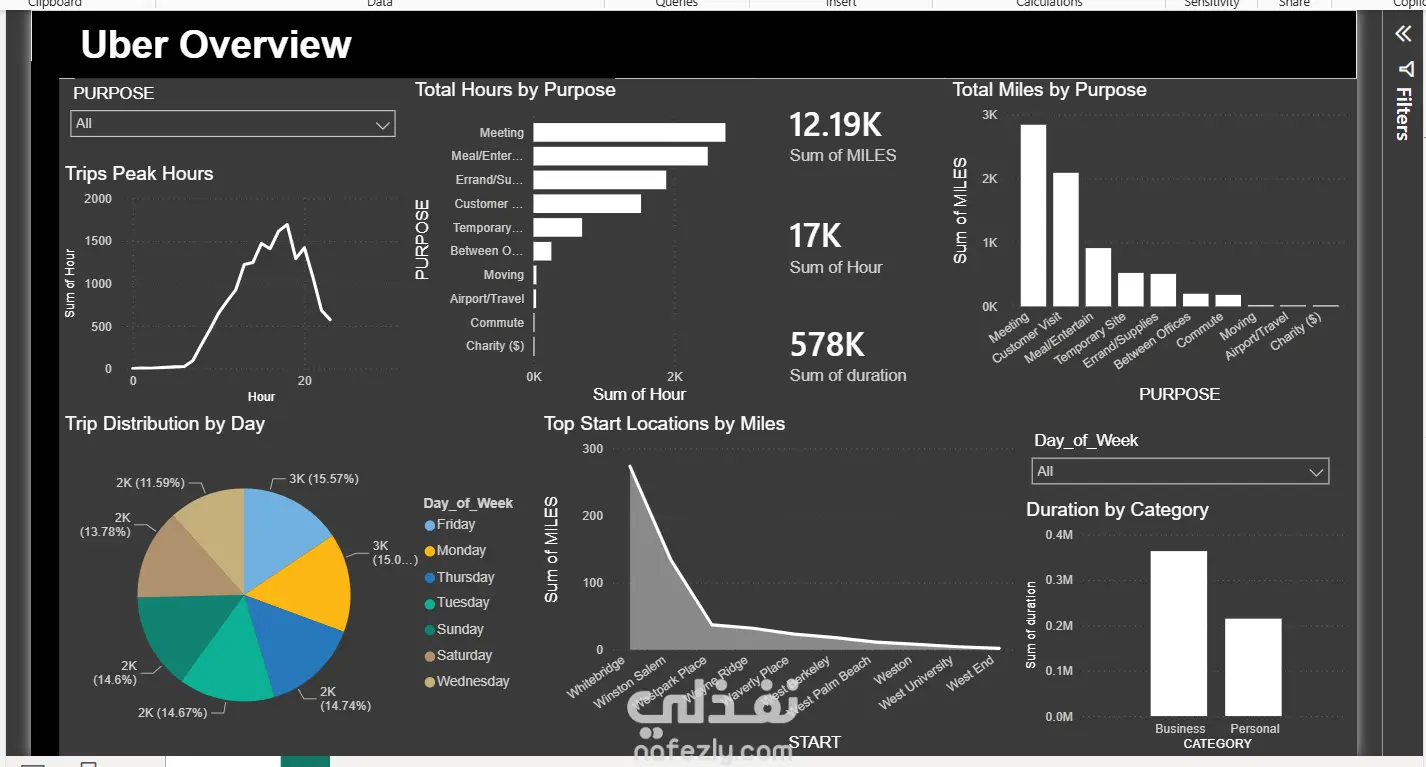
Uber Data Analysis & Optimization Project 📌 Project Overview This project focuses on analyzing Uber trip data to uncover key operational insights that help reduce passenger wait times and increase completed rides. By performing Exploratory Data Analysis (EDA) using Python, the analysis reveals clear patterns in trip types, peak hours, and high-demand locations. 📈 Key Insights & Results Peak Demand Hours: The analysis identified a major surge in trip volume between 1:00 PM and 6:00 PM, peaking at 3:00 PM (98 trips). This aligns perfectly with daily commuting hours. 100% Completed Round Trips: Successfully analyzed 288 trips where the start and stop locations were identical. The data proved that all 288 were completed, high-mileage round trips, with zero cancelled/ghost trips. Top Locations: Identified high-frequency drop-off hubs (such as Cary and Morrisville) to help optimize driver positioning before peak hours. 🛠️ Tech Stack Language: Python Libraries: Pandas, Matplotlib, NumPy Environment: Google Colab Data Visualization & Dashboard After cleaning and exploring the data using Python, I designed an interactive dashboard using Power BI to provide an executive overview of the Uber rides dataset. Key Insights: Peak Hours: Identified the busiest times for rides during the day. Trip Purpose: Analyzed total miles and hours driven for different purposes (e.g., Meetings, Customer Visits). Category Breakdown: Compared Business vs. Personal ride durations
مهارات العمل