Employee Analytics Dashboard – Workforce Performance & Compensation Insights.
تفاصيل العمل
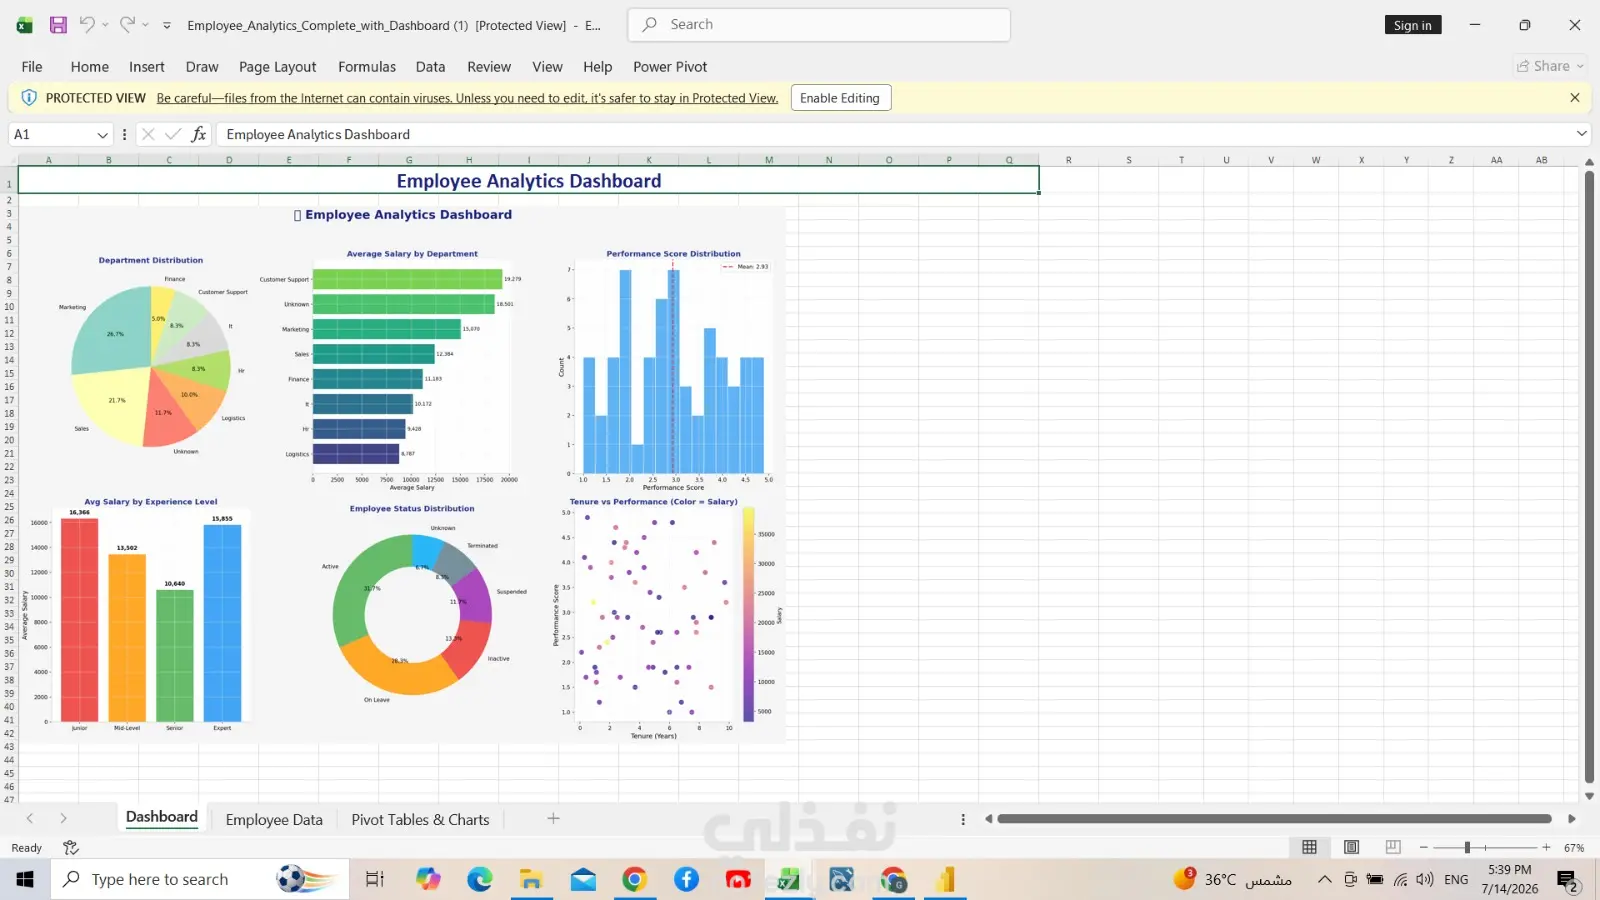
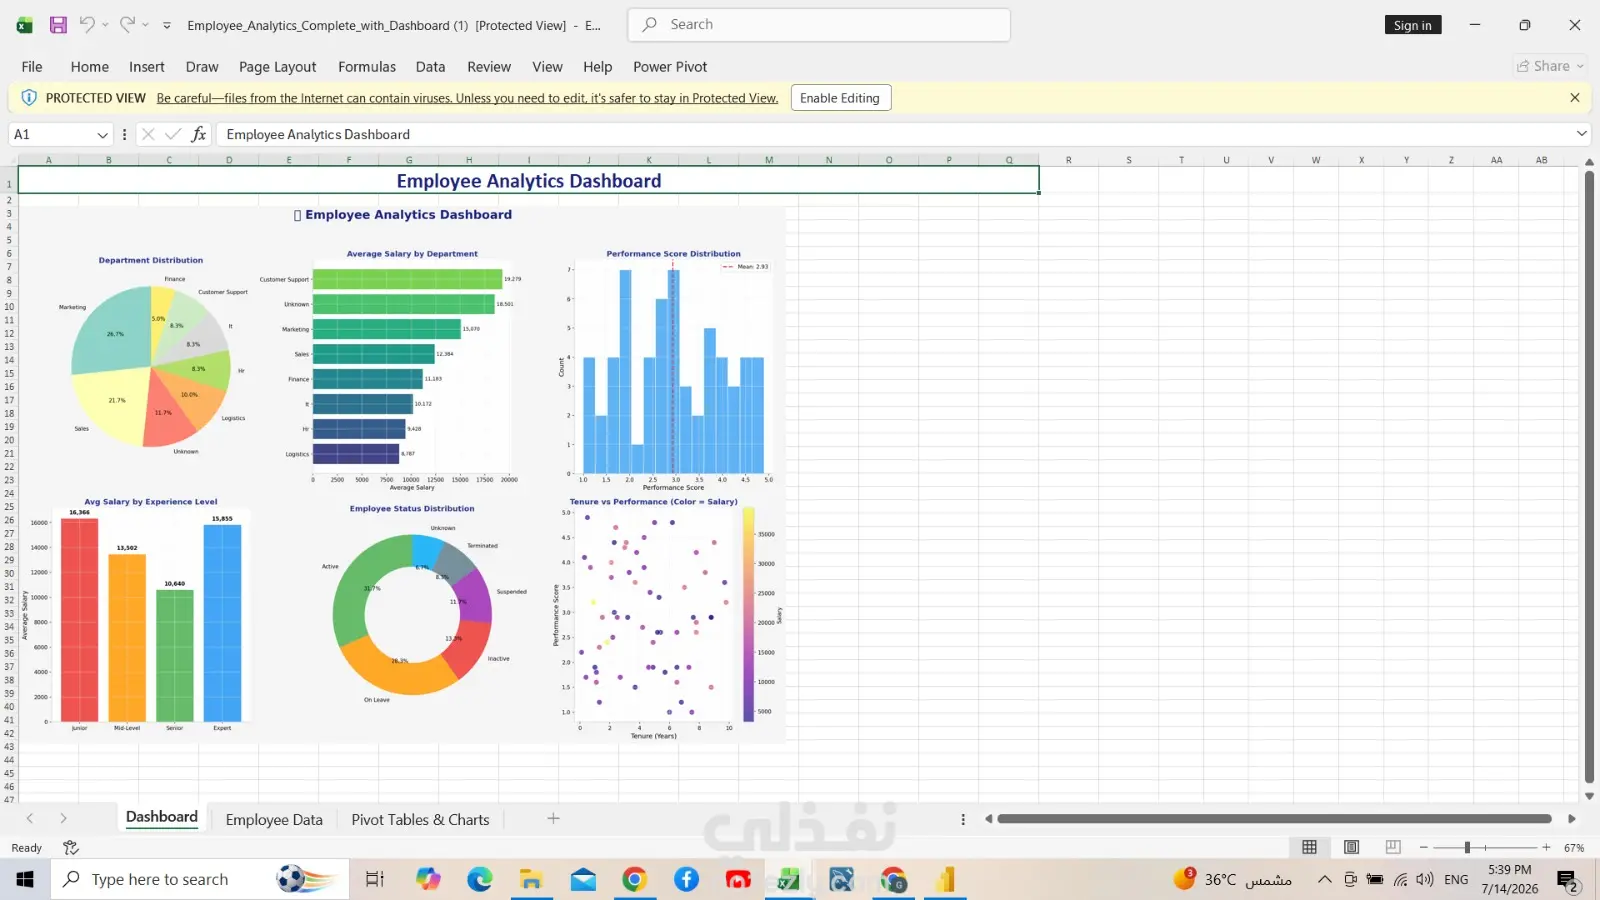
Goals:An interactive dashboard was built to analyze data from 60 employees: departmental distribution, average salaries, performance appraisals, employment status, and the relationship between experience and compensation. The goal is to identify workforce weaknesses and improve hiring and compensation decisions. 2-My Role: Data Analyst & Dashboard Developer – I cleaned up the data (corrected unknown sections and cases), built 6 interactive graphs (Pie, Bar, Histogram, Scatter, Donut), and added interactive filters by section, case, and experience. 3-Outcome:discovered that 48% of employees are not working (on leave/terminated/suspended), and that the salary structure is not linked to experience (junior pays higher than expert pay). The result: a recommendation to review the compensation policy and reassess employment practices. Challenges and Solutions:Incomplete and duplicate data, illogical salary structure, 48% of employees are not working, 60 employees = small sample size. Results:The HR team was able to create an action plan for 21 employees with poor performance and review the salaries of 13 Juniors with salaries higher than Seniors.
مهارات العمل