Supermarket Sales Dashboard – Data Analysis Project
تفاصيل العمل
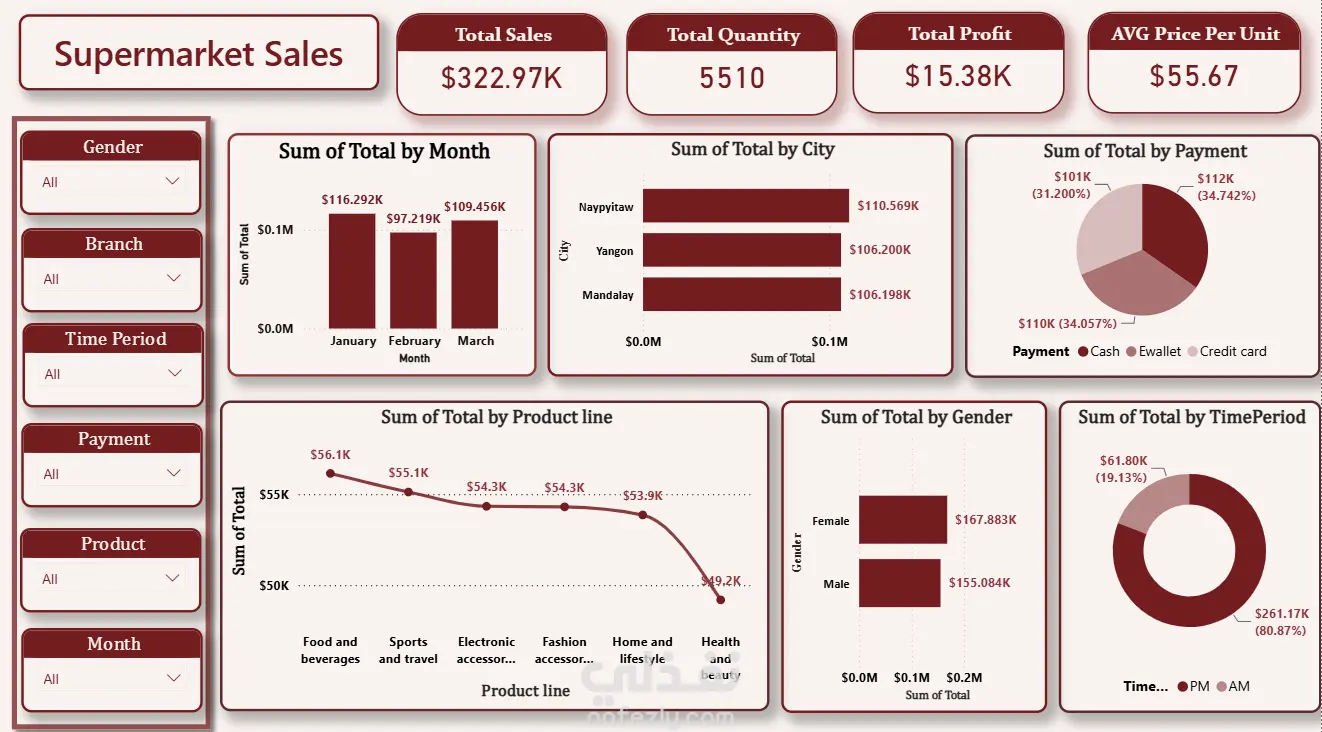
In this project, I worked on analyzing and visualizing supermarket sales data to provide clear insights into sales performance and customer behavior. 1. Data Cleaning & Preparation I started by cleaning and preparing the raw dataset to ensure accuracy and consistency. This included: Removing duplicate and missing values. Correcting data types (dates, numerical values, and categorical fields). Standardizing column names and categories such as payment methods, product lines, and branches. Verifying calculations for total sales, quantity, and profit. This step ensured the data was reliable and ready for analysis. 2. Data Modeling & KPIs After cleaning the data, I created key performance indicators (KPIs) to summarize business performance: Total Sales Total Quantity Sold Total Profit Average Price per Unit These KPIs provide a quick overview of the supermarket’s overall performance. 3. Interactive Dashboard Design I then built an interactive dashboard to visualize the data and make insights easy to explore. The dashboard includes: Sales by Month: A column chart showing total sales for January, February, and March to identify monthly trends. Sales by City: A bar chart comparing sales performance across different cities (Yangon, Mandalay, Naypyitaw). Sales by Product Line: A line chart highlighting how different product categories contribute to total sales. Sales by Gender: A comparison of total sales generated by male and female customers. Sales by Payment Method: A pie chart showing the distribution of sales across Cash, E-wallet, and Credit Card payments. Sales by Time Period: A donut chart comparing sales during AM and PM periods. 4. Filters & Interactivity To enhance usability, I added interactive filters that allow users to analyze the data dynamically: Gender Branch Time Period Payment Method Product Line Month These slicers enable users to drill down into specific segments and answer business questions easily. 5. Business Insights The dashboard helps stakeholders: Identify top-performing months, cities, and product lines. nderstand customer purchasing behavior by gender and payment method. Analyze peak sales times and optimize operations accordingly.
مهارات العمل