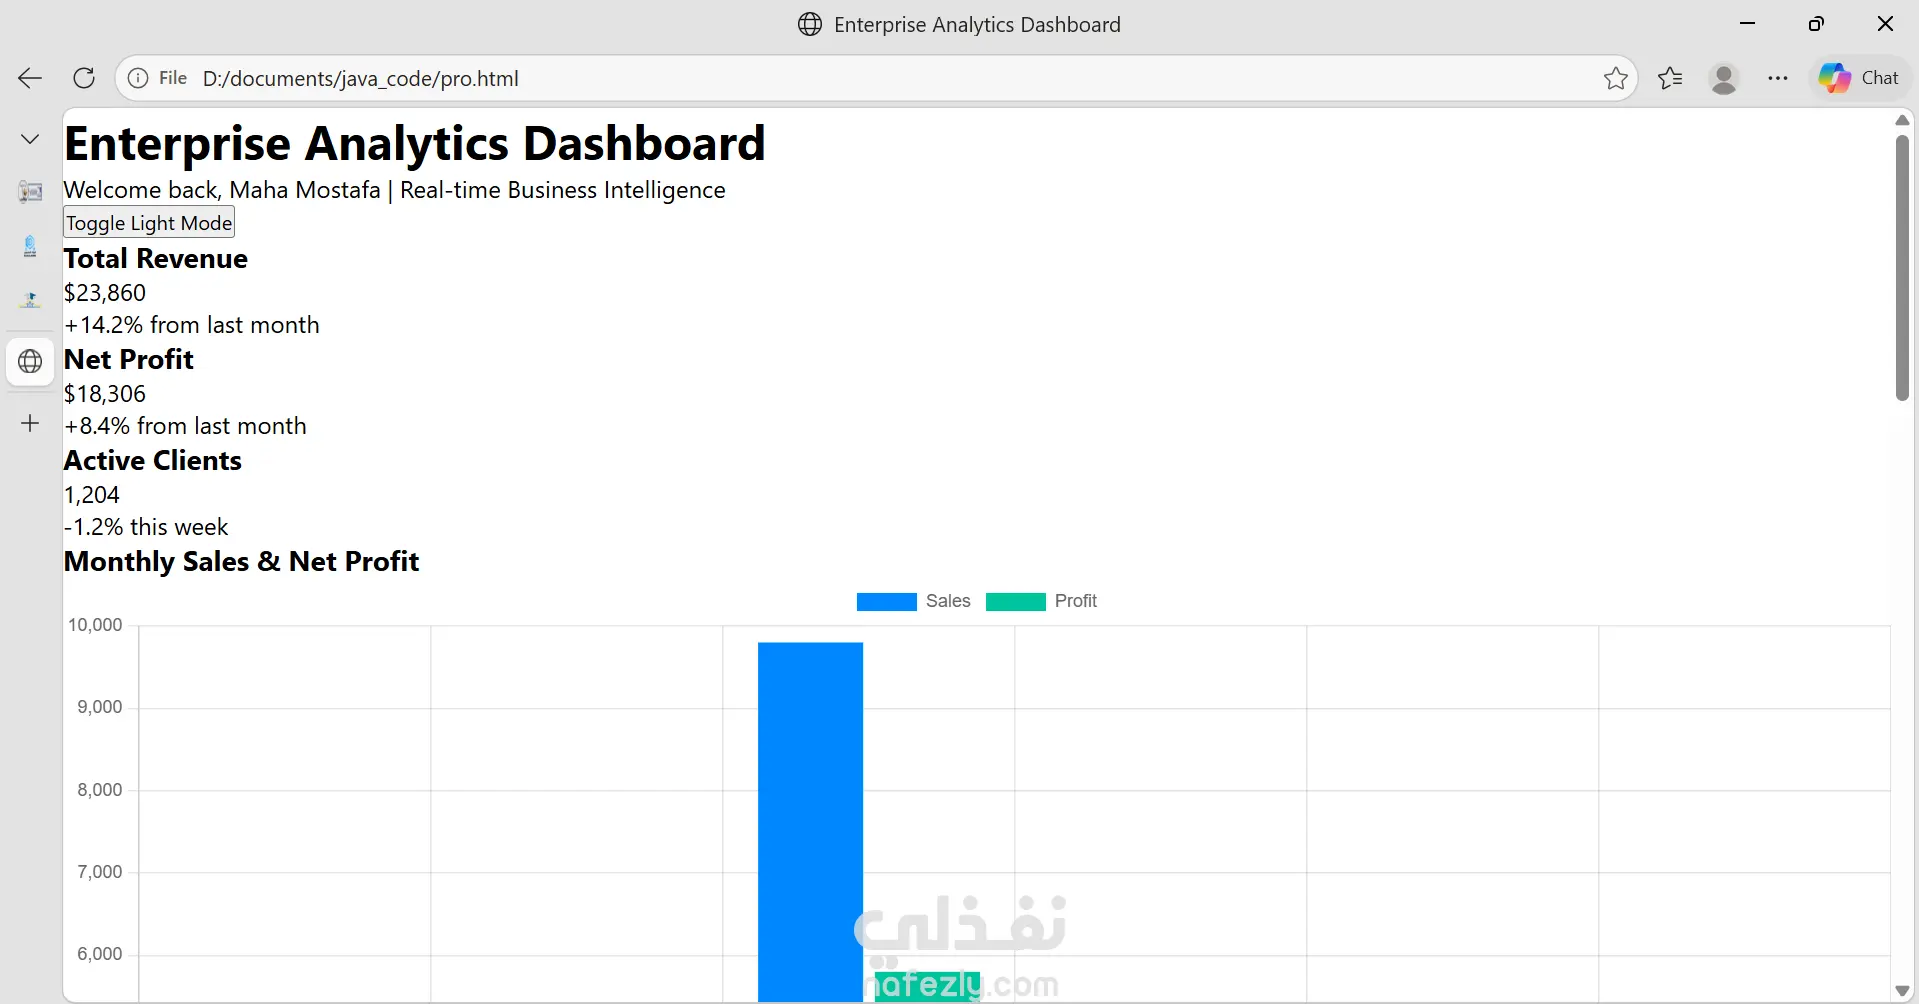
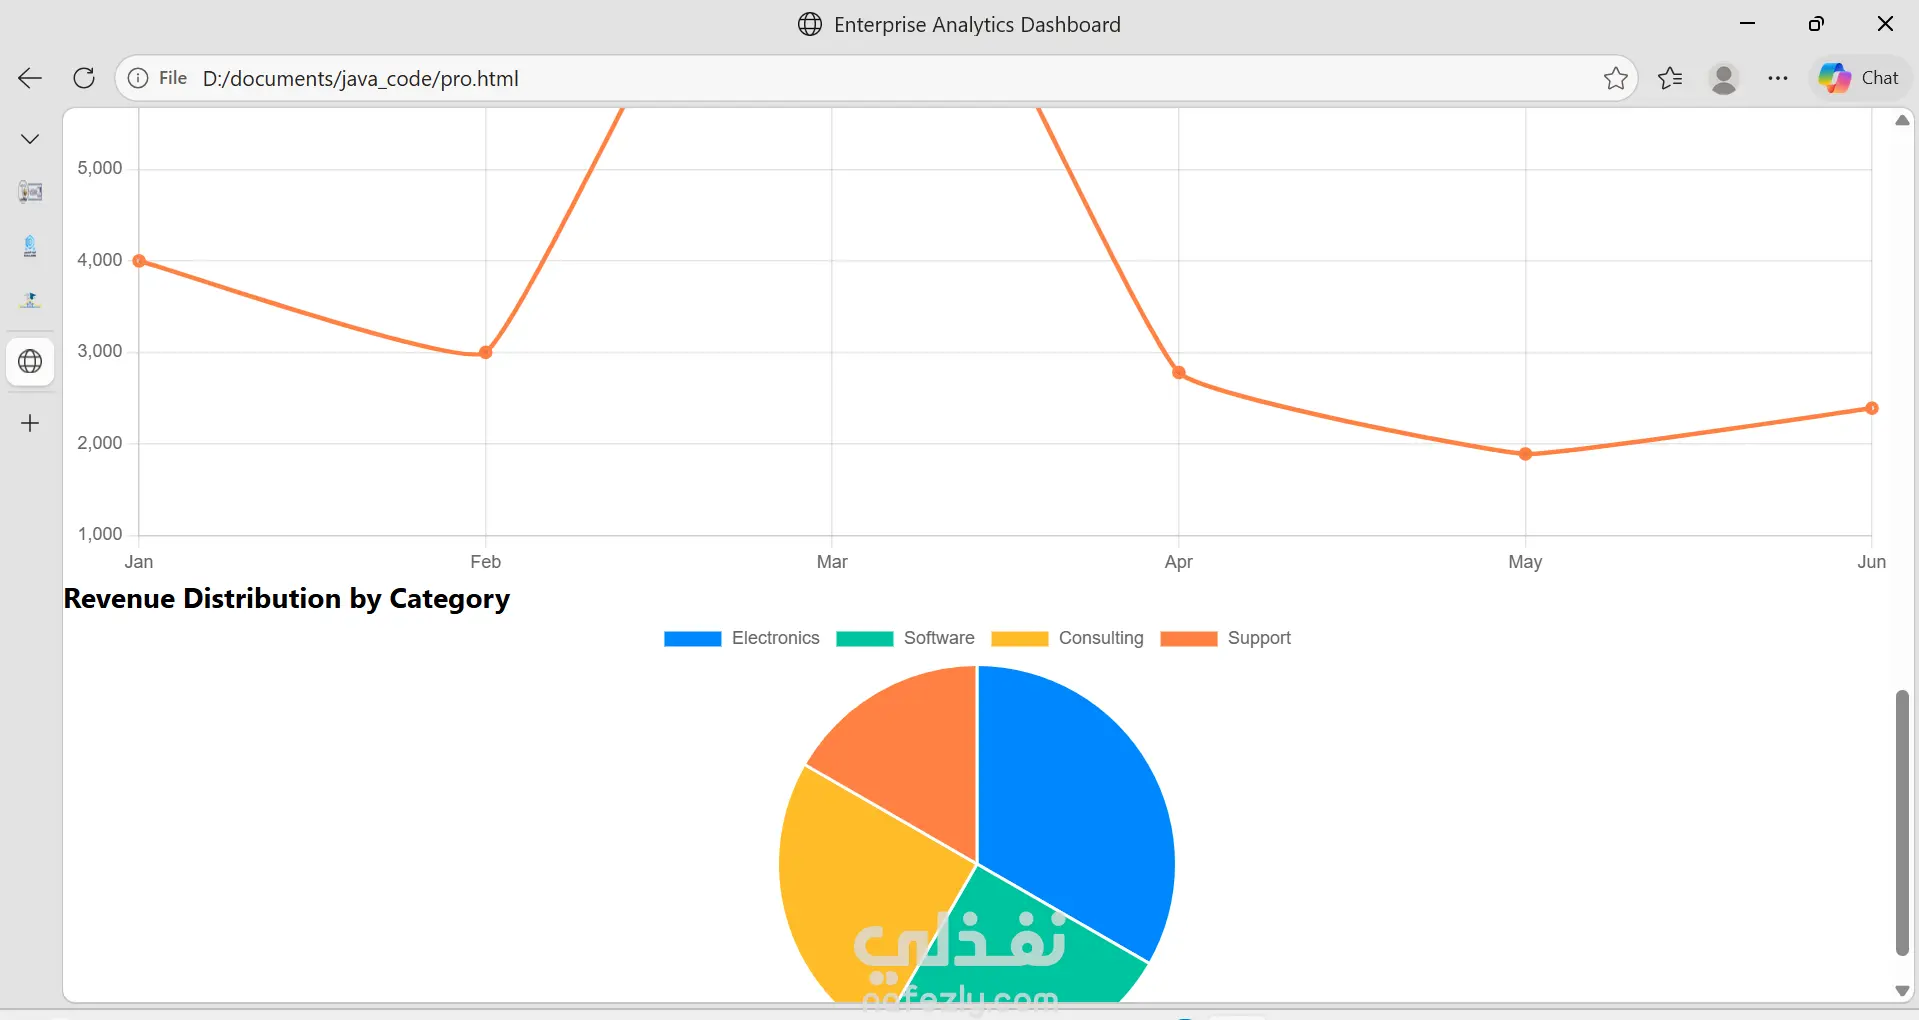
A high-performance, fully responsive web application designed for real-time business intelligence and data visualization. This dynamic dashboard provides corporate teams with actionable insights by tracking key performance indicators (KPIs) like Total Revenue, Net Profit, and Active Clients. It features interactive data analytics charts, including multi-variable bar charts for monthly sales comparison, smooth trend lines for growth performance, and itemized pie charts for revenue distribution. The platform is also equipped with a seamless Dark/Light mode toggle to optimize user experience across different environments