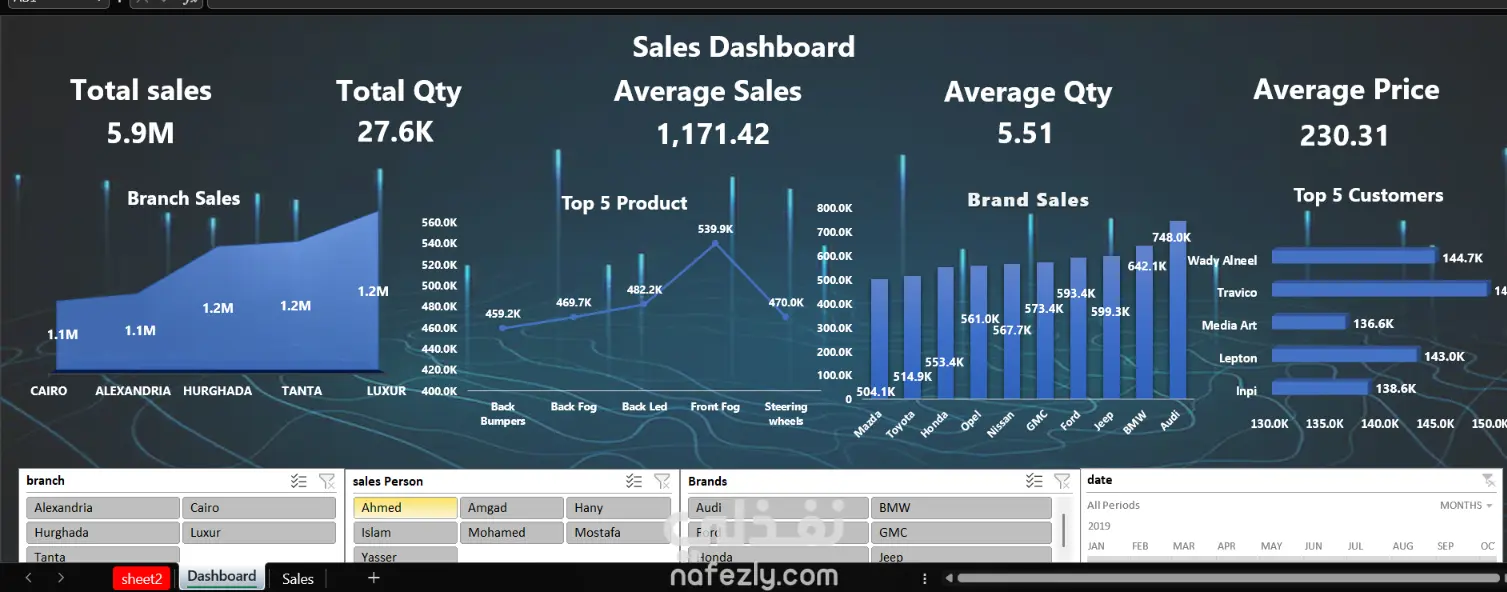
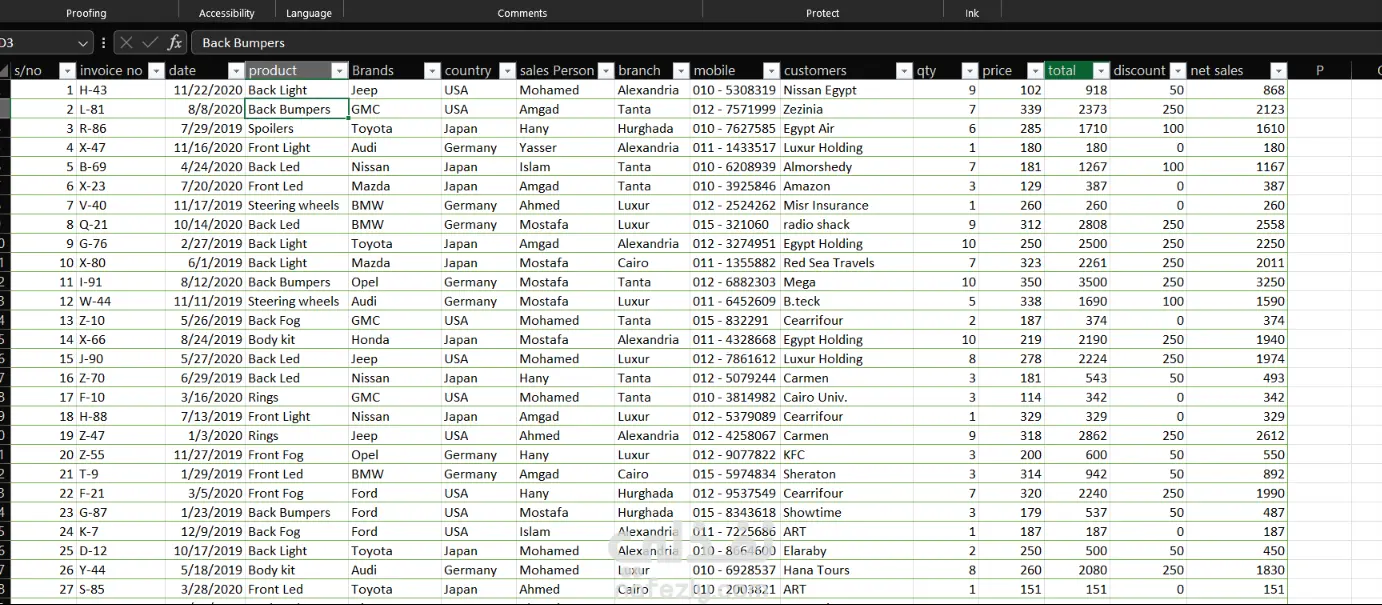
This is a comprehensive, dynamic, and visually engaging Sales Dashboard designed in Microsoft Excel to track and analyze business performance metrics across various dimensions. The dashboard transforms raw transactional data into actionable insights for stakeholders.
Key Metrics Tracked (KPIs):
Total Sales: $5.9M (Overall revenue performance).
Total Quantity Sold: 27.6K units.
Average Sales per Transaction: 1,171.42
Average Quantity per Order: 5.51
Average Unit Price: 230.31
Visualizations & Insights Included:
Branch Sales Analysis: A customized area chart comparing revenue trends across key branches (Cairo, Alexandria, Hurghada, Tanta, and Luxor).
Top 5 Products: A line chart highlighting performance for peak products (such as Front Fog, Back Led, etc.).
Brand Sales Distribution: A column chart analyzing sales volumes across major automotive brands (including Audi, BMW, Ford, GMC, Honda, Jeep, and Toyota).
Top 5 Customers: A horizontal bar chart identifying high-value clients and distributors contributing to the business growth.
Technical Features:
Fully interactive using custom Excel charts and advanced formatting.
Structured navigation with separate data, lookup, and dashboard tabs (Sales, Dashboard, sheet2).
Modern dark-themed user interface (UI) designed for executive-level presentations and quick decision-making.