Turning Restaurant Data into Growth Strategies 🍔📈
تفاصيل العمل
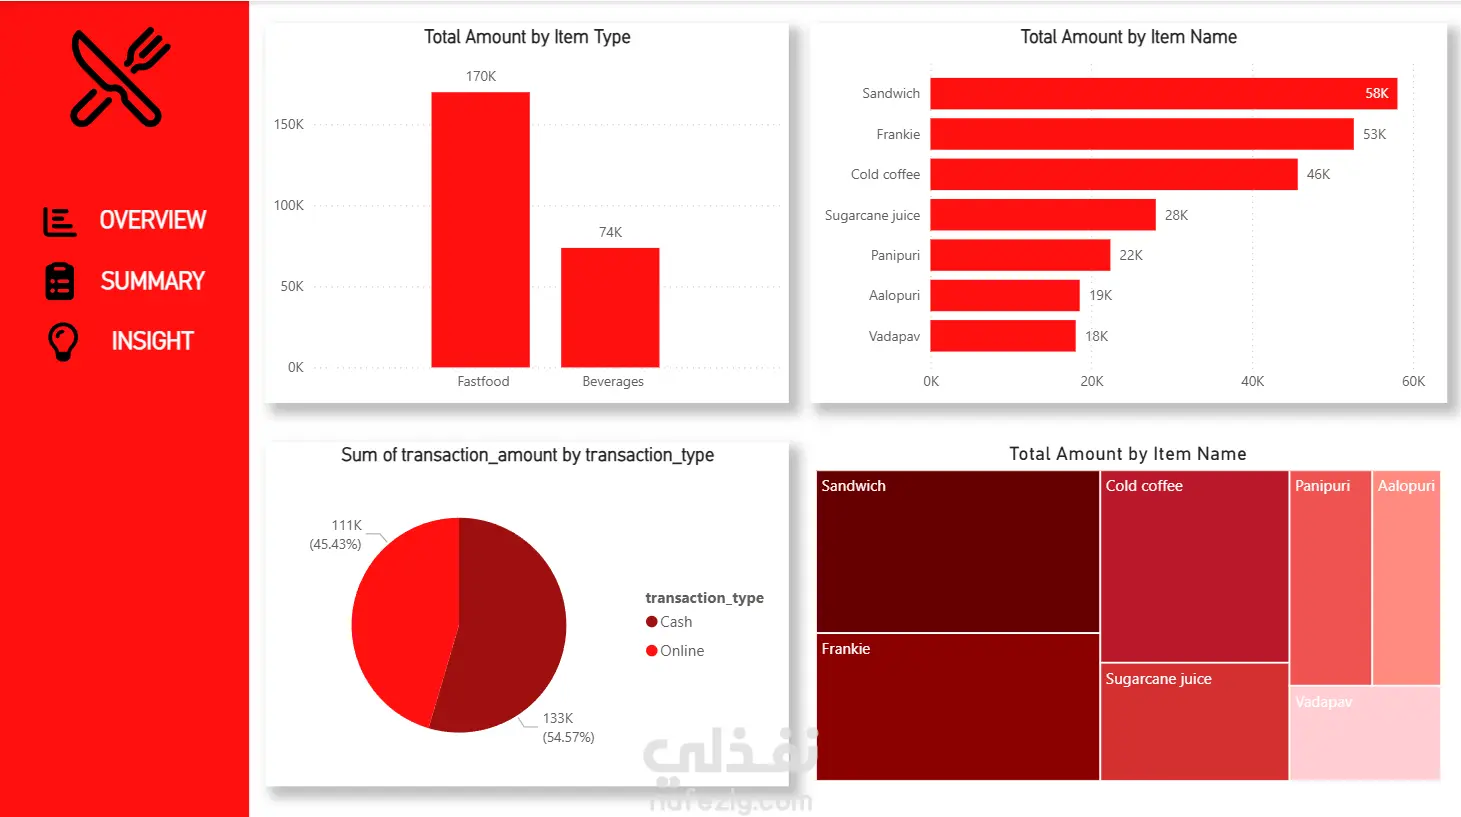
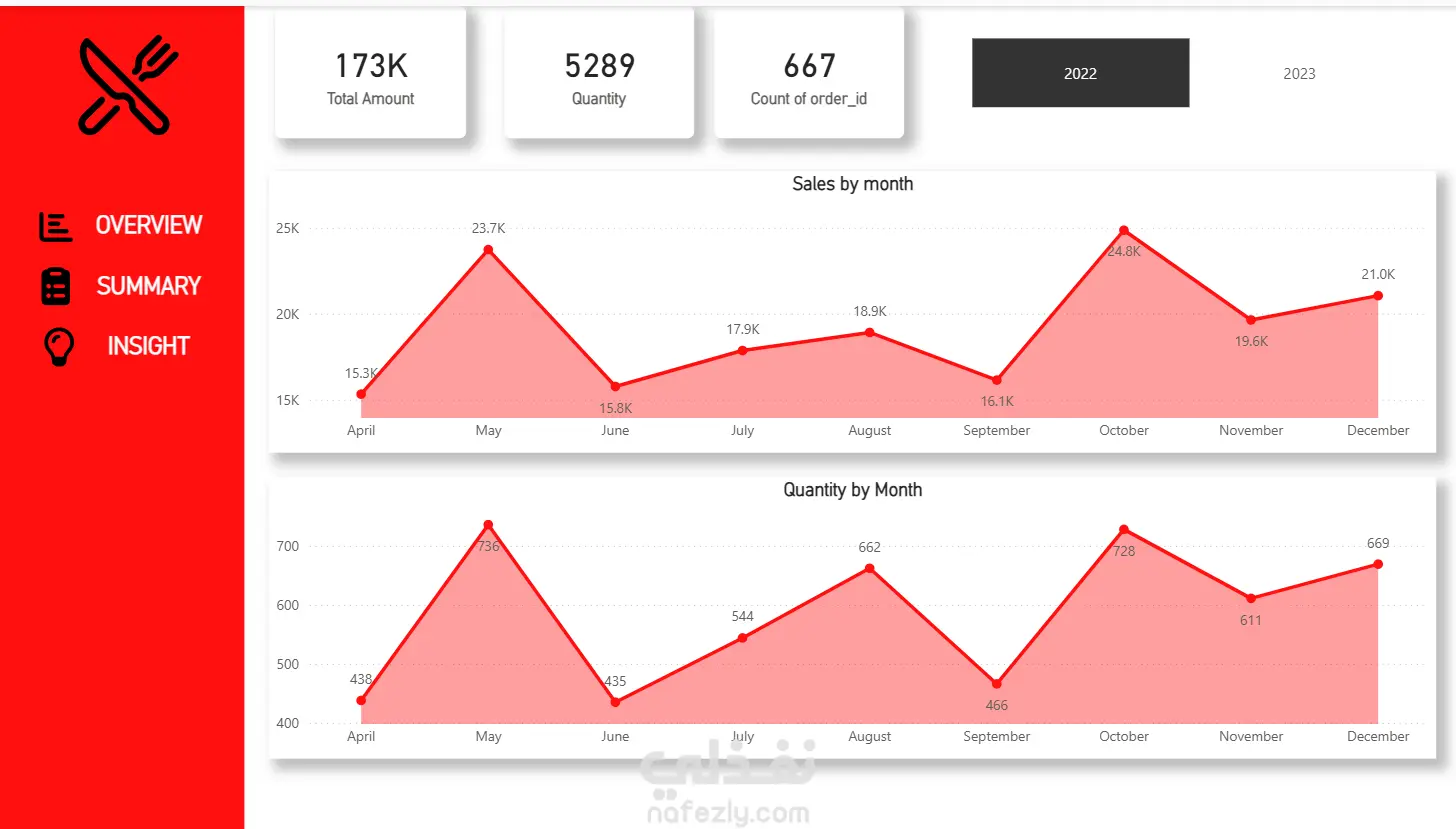
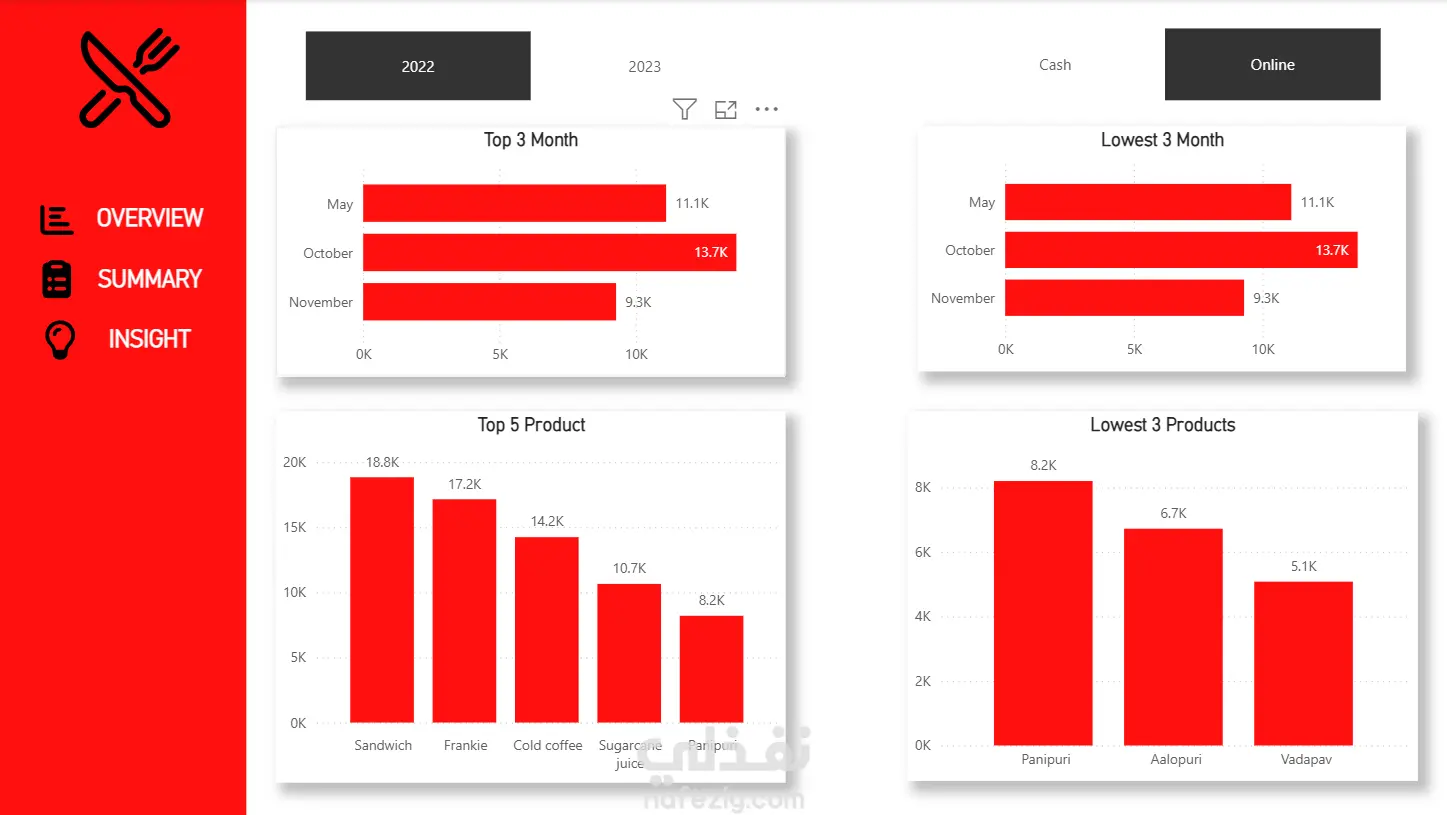
Data is the secret ingredient in the Food & Beverage industry! I’m excited to share my latest Power BI project—a deep-dive analysis of sales performance and consumer behavior for a food outlet. This project was a journey of turning thousands of transactions into a clear visual story that answers three critical questions: What is selling, When is the peak, and How are customers paying? Key Insights from the Dashboard: ✅ The "Winner" Items: Sandwiches and Frankies are the clear revenue drivers, contributing the lion's share of the 173K Total Amount. ✅ Seasonal Fluctuations: Sales aren't static—May and October showed massive spikes in both revenue and quantity, while June and September needed more promotional focus. ✅ Payment Dynamics: A fascinating 54% vs 45% split between Cash and Online transactions, highlighting the importance of a seamless digital payment experience. ✅ Performance Gaps: By identifying the "Lowest 3 Products" (like Vadapav), businesses can decide whether to revamp the recipe or adjust the pricing. A Journey of Learning & Growth 🎓 This project wouldn't have been possible without the guidance and high-quality training I received. I want to express my sincere gratitude to: My Mentor: Mohamed Mohsen Zahra – Thank you for the technical insights, the feedback on DAX, and for teaching me how to think like a Data Analyst, not just a tool user. EraaSoft – For providing the environment and resources to master Power BI & Power Query. I'm looking forward to applying these analytical skills to even more complex business challenges.
مهارات العمل
بطاقة العمل

طلب عمل مماثل