📊 Sales Performance Analysis | Business-Driven Insights using Power BI
تفاصيل العمل
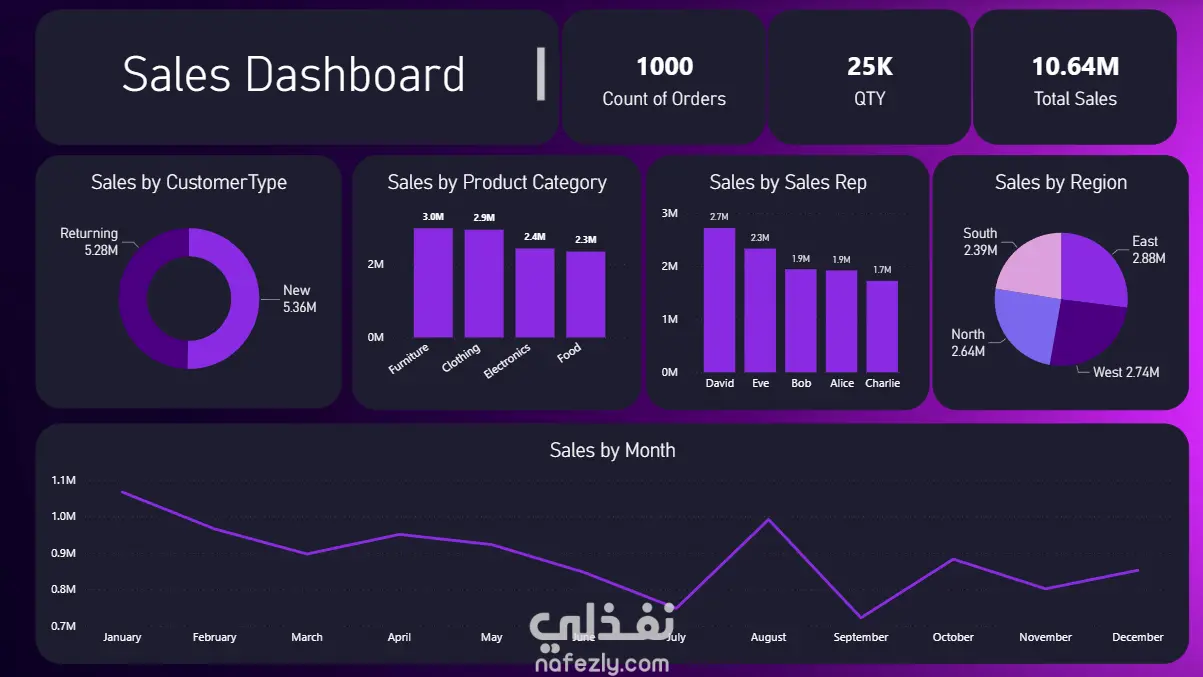
This project goes beyond visualization and focuses on turning sales data into business decisions. Using Excel & Power Query for data cleaning and modeling, and DAX for advanced measures and KPIs, I analyzed sales performance across customers, products, regions, and time to identify growth opportunities and risks. 🔹 Business Insights & Impact 🔹 Revenue Stability & Growth Potential Total sales reached 10.64M across 1,000 orders, showing a healthy revenue base. Sales are evenly split between new and returning customers, indicating strong acquisition and retention. ➡️ Business action: Scale loyalty programs to increase customer lifetime value (CLV). 🔹 Product Portfolio Optimization Furniture and Clothing generate the highest revenue. Other categories show lower contribution but consistent demand. ➡️ Business action: Focus marketing and inventory on high-margin categories while improving cross-selling for weaker ones. 🔹 Sales Team Effectiveness A clear performance gap exists between top and low-performing sales reps. ➡️ Business action: Replicate top-performer strategies to improve overall team productivity. 🔹 Regional Strategy Insight Sales performance is relatively balanced across regions, with South slightly underperforming. ➡️ Business action: Launch targeted regional campaigns instead of broad, high-cost marketing. 🔹 Seasonality & Forecasting Sales peak in August and drop sharply in September. ➡️ Business action: Adjust inventory planning and promotional timing to reduce revenue volatility. 🛠 Tools & Skills Applied Excel – Data cleaning & validation Power Query – Data transformation & modeling Power BI – Executive-level dashboarding DAX – Business KPIs, customer segmentation, and time intelligence 🎯 Key Takeaway Data analysis is not about charts — it’s about supporting business decisions, reducing risk, and identifying growth opportunities.
مهارات العمل
بطاقة العمل

طلب عمل مماثل