Uber Business Performance Dashboard – Key Insights
تفاصيل العمل
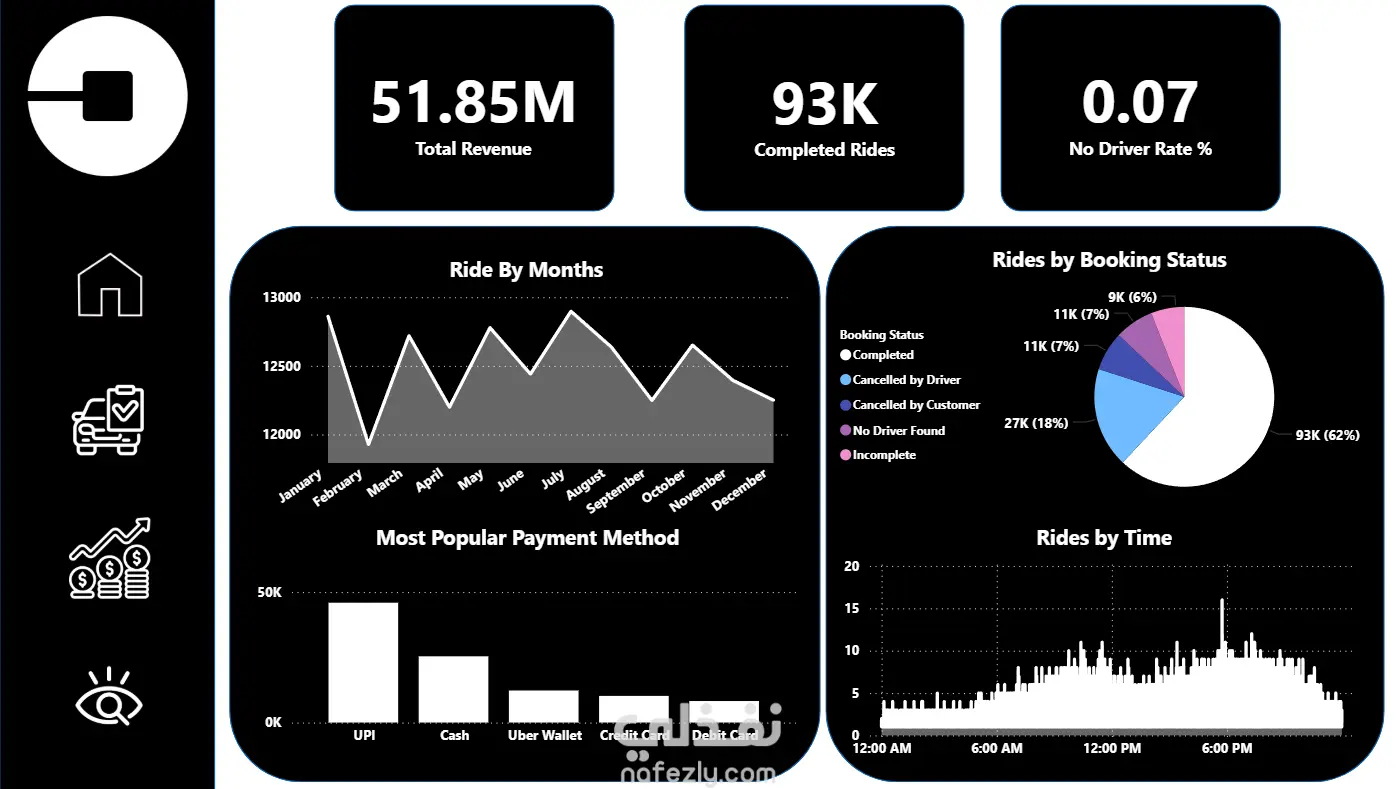
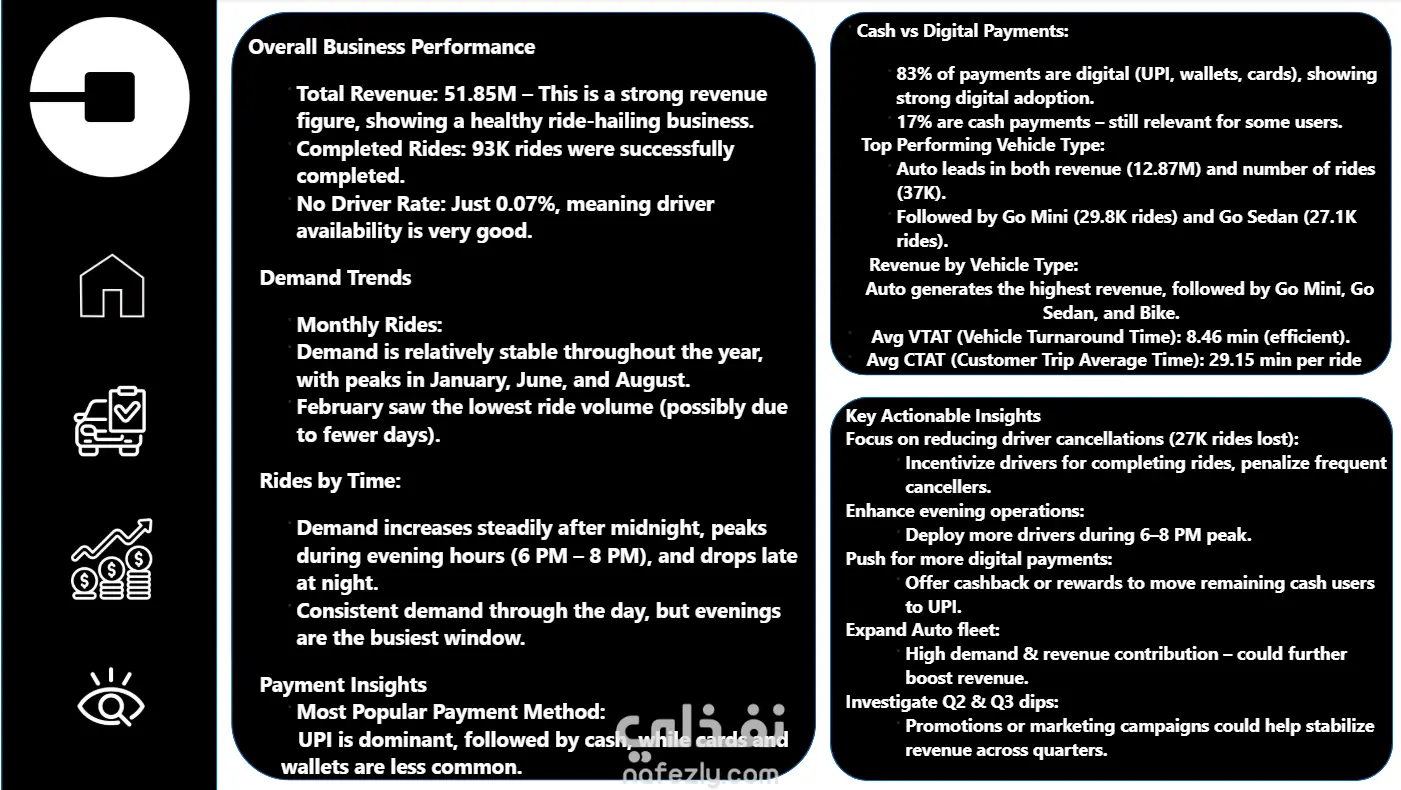
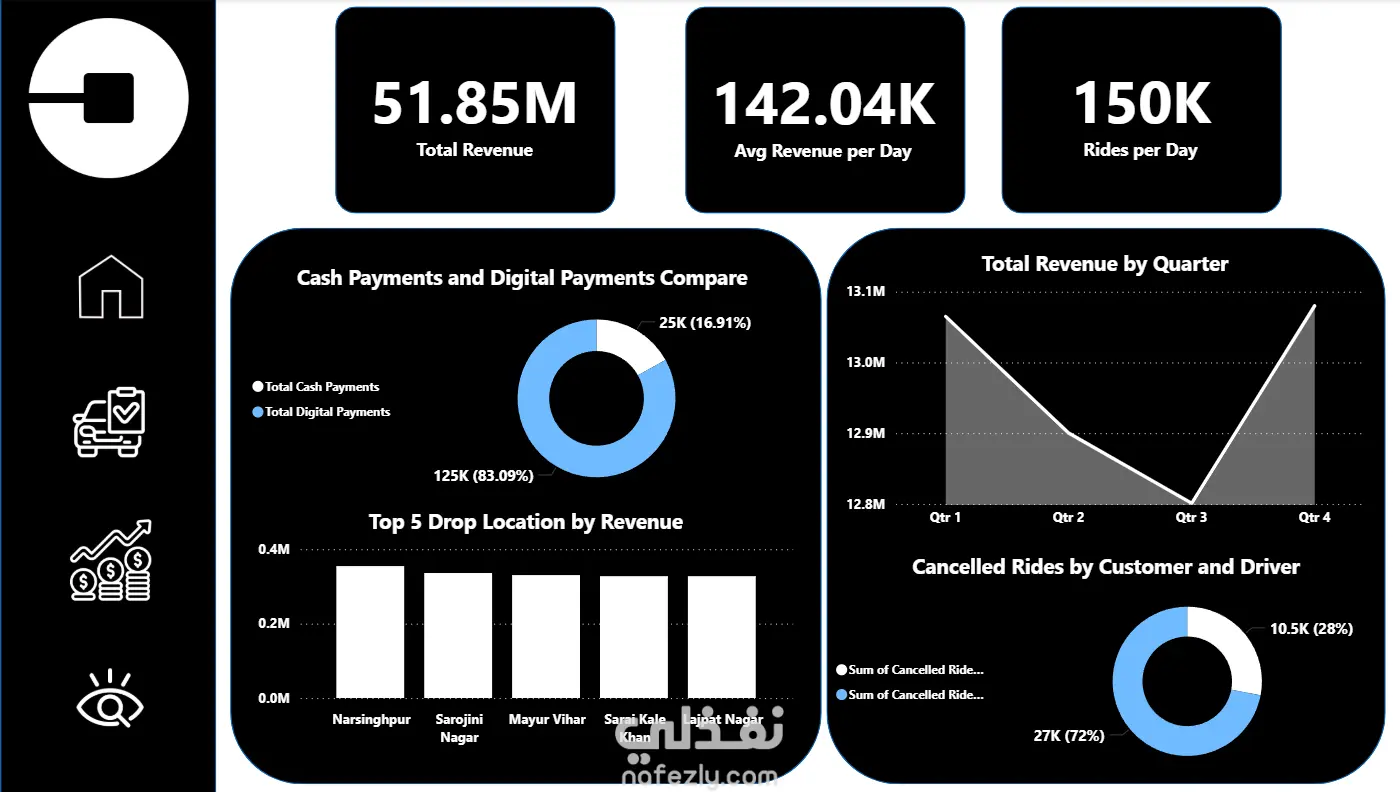
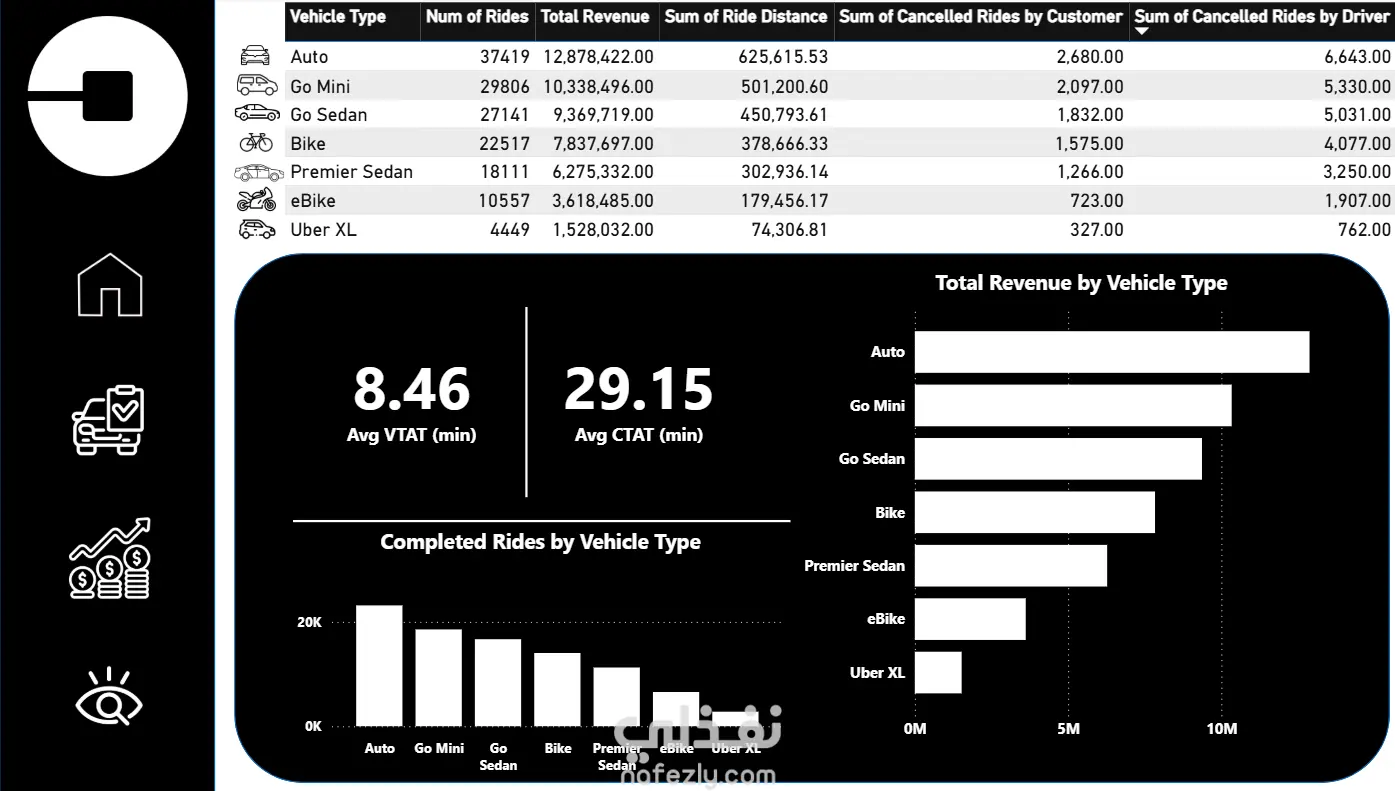
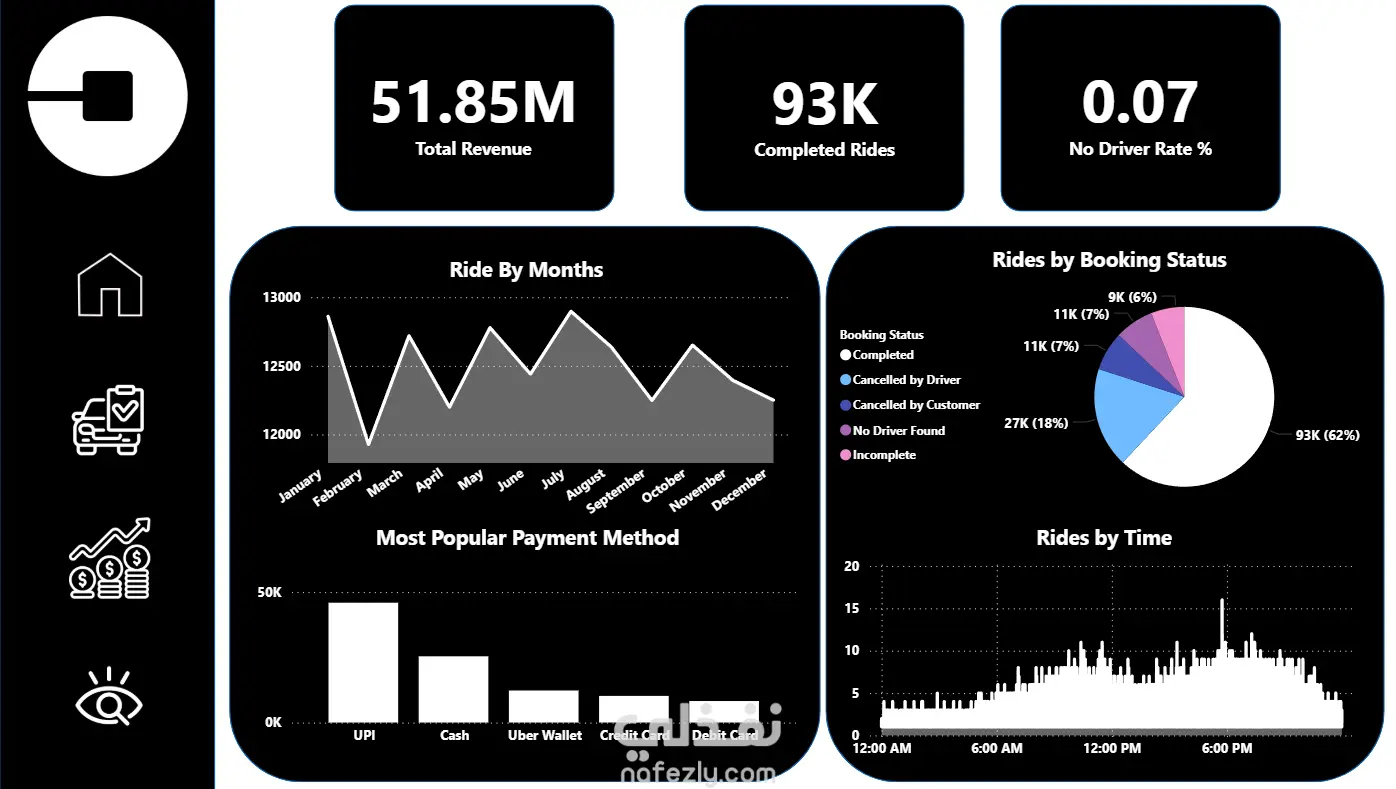
I recently analyzed ride-hailing business performance, and here are some powerful insights from the dashboards: Overall Business Performance Total Revenue: 51.85M – a strong and healthy growth indicator. Completed Rides: 93K successfully completed. No Driver Rate: just 0.07%, showing great driver availability. Demand Trends Monthly Rides: Stable throughout the year with peaks in January, June, and August. Rides by Time: Consistent demand all day, but 6–8 PM is the busiest window. Payment Insights UPI leads as the most popular method, followed by cash. 83% Digital Payments vs 17% Cash, showing strong digital adoption. Vehicle Performance Auto is the top performer with 12.87M revenue and 37K rides. Go Mini and Go Sedan follow in both revenue and completed rides. Avg Vehicle Turnaround Time: 8.46 min (efficient). Avg Customer Trip Time: 29.15 min. Key Actionable Insights Reduce 27K driver cancellations with incentives and stricter policies. Enhance evening peak operations by deploying more drivers. Push digital adoption with rewards to move more users from cash to UPI. Expand Auto fleet to further boost revenue. Investigate Q2 and Q3 dips with promotions or marketing campaigns. Data-driven insights like these highlight how dashboards empower decision-making, improve efficiency, and guide growth strategies in mobility businesses.
مهارات العمل
بطاقة العمل

طلب عمل مماثل