HR Analytics Dashboard Project
تفاصيل العمل
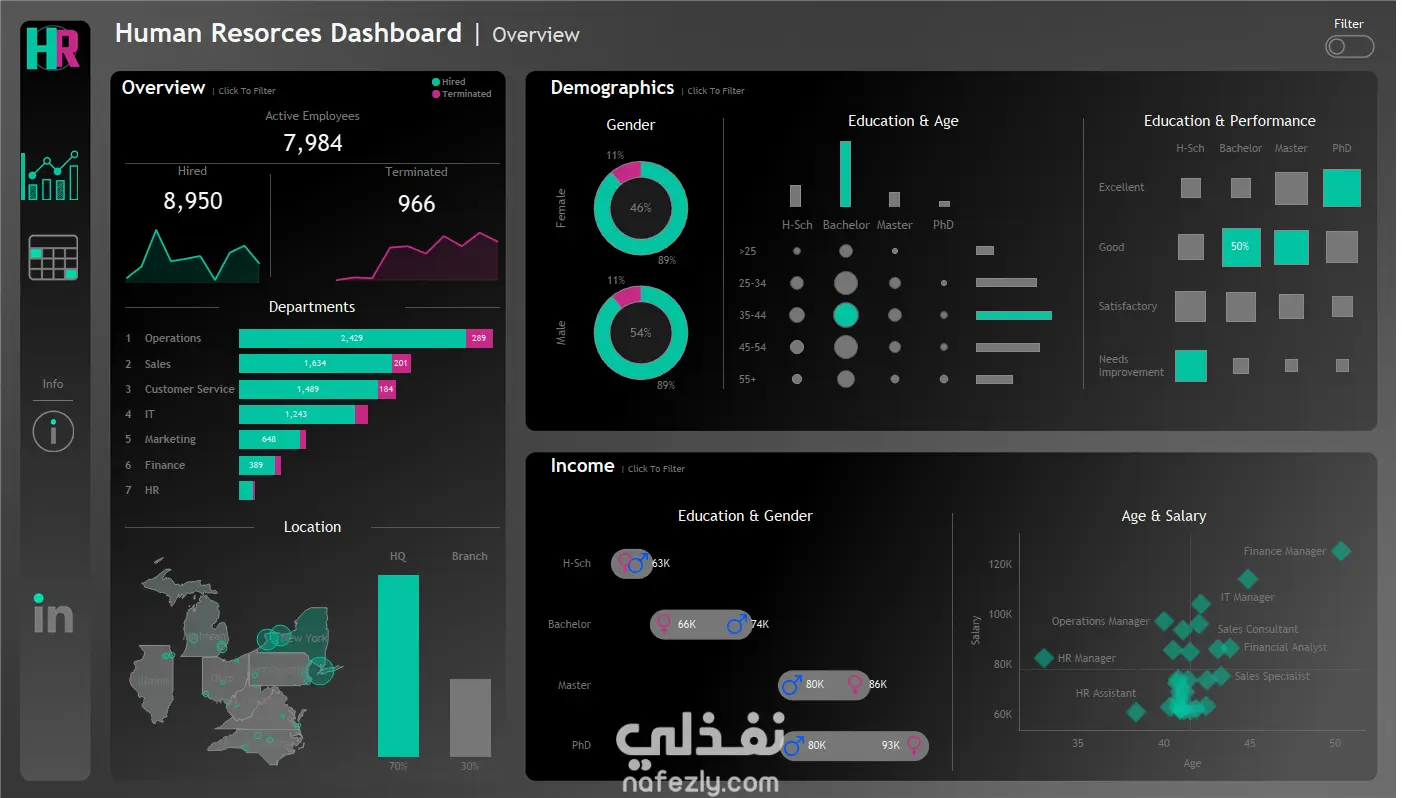
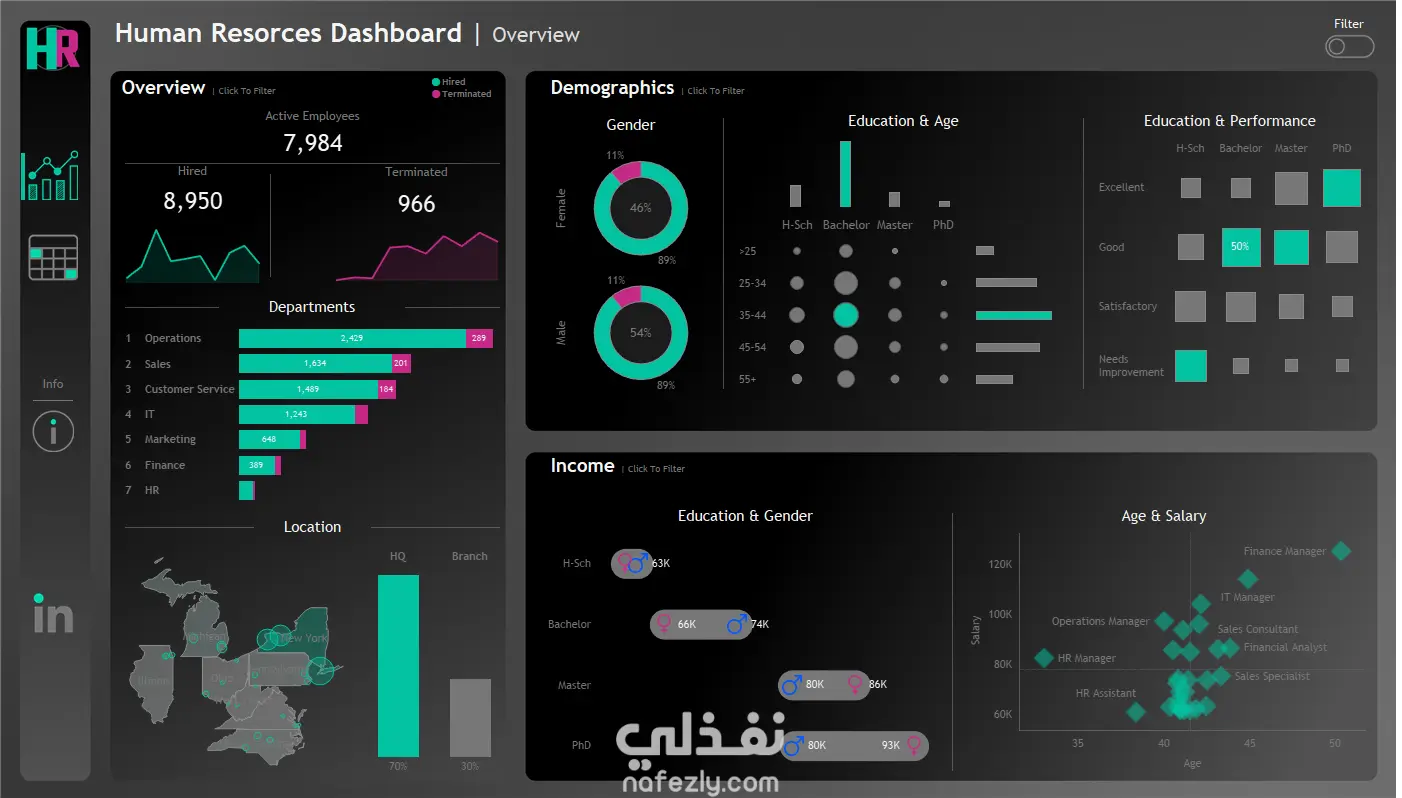
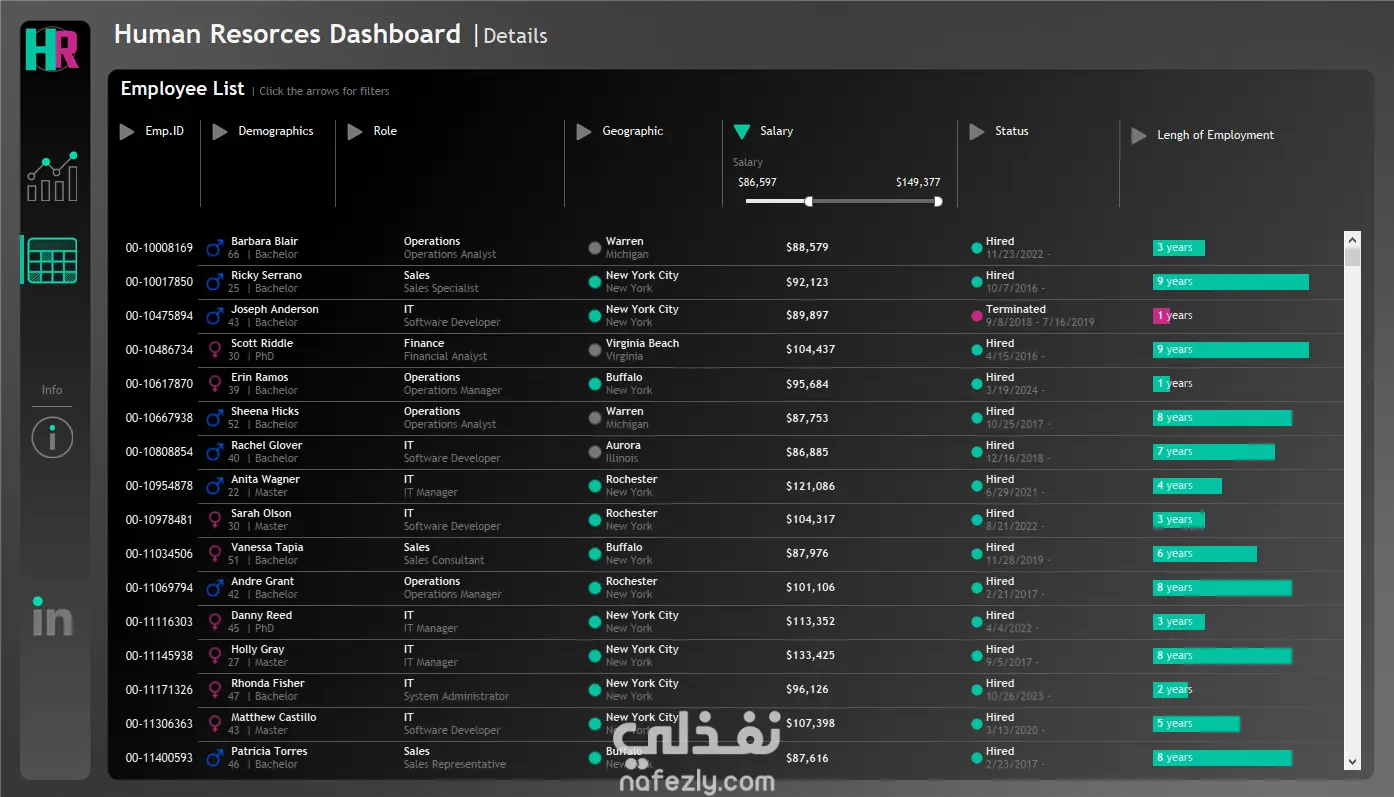
In this project, I worked on building an interactive dashboard to help make sense of HR data in a simple and practical way. Instead of just looking at raw numbers, the goal was to turn the data into clear insights that can actually help in decision-making. I used Tableau along with Excel to clean and organize the data, then designed a dashboard that shows key information like employee distribution, hiring trends, salaries, and performance. ]What the dashboard shows: * Total active, hired, and terminated employees * Employee distribution across departments * Gender, age, and education insights * Salary comparison by role, age, and education level * Relationship between performance and education **What I discovered:** * Most employees are concentrated in Operations and Sales * Salaries tend to increase with age, especially in IT and Finance * There isn’t a strong link between education level and performance * Some differences exist in salary distribution between genders **Why this matters:** This kind of dashboard helps businesses understand their workforce better, spot problems early (like turnover), and make smarter HR decisions. 🛠 **Tools used:** * Tableau * Excel I can also create a similar dashboard tailored to your business data and needs.
مهارات العمل