Data Analysis
تفاصيل العمل
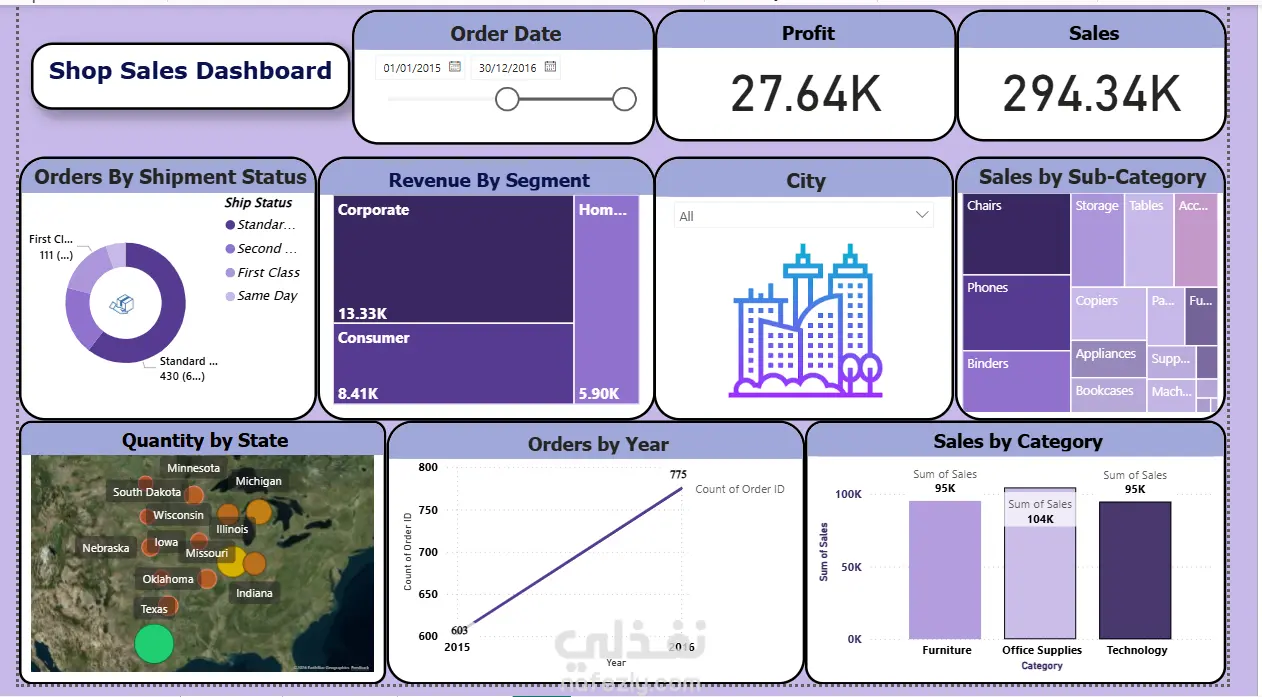
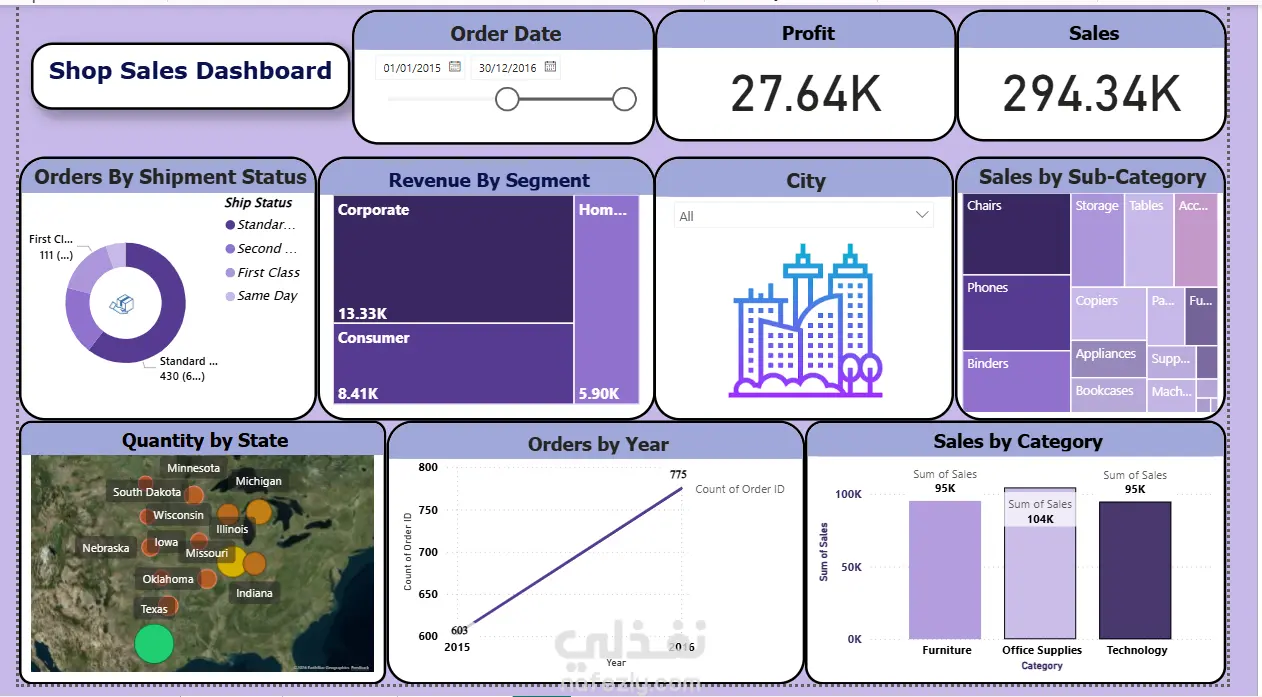
The "Shop Sales Dashboard" in the file **for you.jpg** presents a comprehensive performance overview of retail operations between 2015 and 2016. The dashboard highlights key financial metrics, including total sales of 294.34K and a total profit of 27.64K, while visually breaking down revenue through segments like Corporate and Consumer. It utilizes a variety of visualizations, such as bar charts comparing sales categories where Office Supplies leads at 104K, treemaps for sub-category performance, and a donut chart showing that Standard Class is the primary shipping method. Furthermore, a line graph illustrates a growth in order volume from 603 to 775 over the two-year period, complemented by a bubble map showing high product quantities sold across states like Texas, Illinois, and Michigan.
مهارات العمل
بطاقة العمل

طلب عمل مماثل