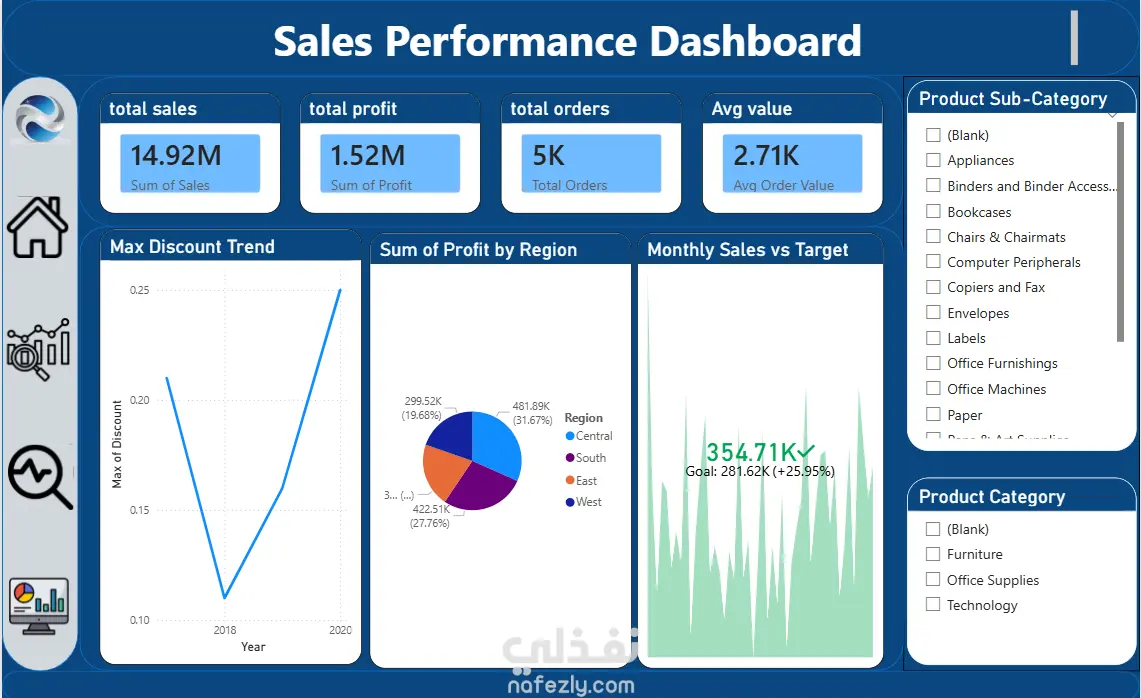
This project focuses on analyzing sales performance and transforming raw data into actionable business insights using Power BI.
The goal was to build an interactive dashboard that enables decision-makers to monitor performance, identify trends, and optimize business strategies.
What I did:
Cleaned and prepared raw sales data using Excel
Designed a structured data model for analysis
Built an interactive Power BI dashboard for real-time insights
Key Features:
Tracking Total Sales, Total Profit, Total Orders, and Average Order Value
Monthly Sales vs Target performance analysis
Profit distribution by region
Discount trend analysis to evaluate its impact on profitability
Dynamic filtering by product category and sub-category
Key Insights:
Increasing discounts negatively impacts overall profit margins
Certain regions contribute more to profit despite lower sales volume
Sales performance shows fluctuations across different periods
Business Value:
This dashboard helps businesses make data-driven decisions by highlighting performance gaps, identifying growth opportunities, and improving overall sales strategy.
Tools Used:
Power BI
Excel